11Chapter 11 - Illustrating the simple linear regression with an example
It depends on the context of the variables of a regression model, the coefficients can give us interesting insights about the relationship between the variables.
In the following section I give the example of the Market Regression model where the Y variable is the return of a stock and the X variable is the return of the market.
11.1 The Market Regression Model
The Market Model in Finance can be estimated using a simple regression model. The Market Model - also called the Single-Index Model - states that the expected return of a stock is given by its alpha coefficient (b0) plus its market beta coefficient (b1) times the market return. In mathematical terms:
E[R_i] = α + β(R_M)
We can express the same equation using b_0 as alpha, and b_1 as market beta:
E[R_i] = b_0 + b_1(R_M)
We can estimate β_0 and β_1 with the OLS method by running a linear regression model specifying that the market return is the independent variable (IV) and the stock return is the dependent variable (DV).
It is strongly recommended to use continuously compounded returns (r_i) instead of simple returns (R_i) to estimate the market regression model.
The market regression model can be expressed as:
r_{(i,t)} = b_0 + b_1*r_{(M,t)} + \varepsilon_t
Where:
ε_t is the error at time t. Thanks to the Central Limit Theorem, this error behaves like a Normal distributed random variable ∼ N(0, σ_ε) since the error can be expressed as a sum of products; the error term ε_t is expected to have mean=0 and a specific standard deviation σ_ε (also called volatility).
r_{(i,t)} is the cc return of the stock i at time t.
r_{(M,t)} is the market cc return at time t
b_0 and b_1 are the regression coefficients
11.2 Level of significance of the beta coefficients
The regression output automatically performs hypothesis testing for the beta coefficients. One hypothesis test is performed for each beta coefficient.
The hypotheses for each beta coefficient are:
H0: beta=0
Ha: beta\neq0
Then, the t-Statistic and pvalues are estimated with this null value (beta=0). If we want to check whether b_1 is significantly > 1, we CANNOT use the t-value nor the pvalue reported in the regression output. We can do our own test or we can use the 95% confidence interval reported in the regression output (if the value 1 is NOT included in the 95%C.I. this means that b_1 is significantly different than 1).
The regression output reported by most statistical software includes the following for each beta coefficient:
beta coefficient (OLS BLUE - Best, Linear, Unbiased estimator). It is the mid-point value of its 95% Confidence Interval
Standard error (SE) - the standard deviation of the beta coefficient; it is the expected average movement or variability that the beta will have with new observations or new samples
t-Statistic or tvalue - the # of standard deviations of the coefficient that the estimated beta value is away from the zero (the null value)
pvalue - the probability that I will be wrong if I reject the null hypothesis, which states that the beta = 0. The less the pvalue, the more probable that the alternative hypothesis Ha is true
95% confidence interval - With a probability of 95%, this range will indicate the minimum and maximum possible values of the beta coefficient; it shows how much the beta can move with a 95% probability when new observations are included or new samples from the population are used
11.3 Interpreting regression output of the Market Regression Model
In the case of the market regression model:
Dependent variable Y = the return of a stock
Explanatory variable X = return of the market
In this context, the specific interpretation or the insights we can get from the beta coefficients are:
b_1 is a measure of risk of the stock in relation with the market; it tells us how sensitive a stock return is when the market return moves:
If b_1=1 or is NOT significantly different than 1, this means that the stock is practically equally risky than the market;
if b_1>1 and is significantly bigger than 1, this means that the stock is significantlyriskier than the market;
if b_1<1 and is significantly less than 1, this means that the stock is significantly less risky than the market;
if b_1=0 and is NOT significantly different than 0, this means that the stock is not significantly related to the market.
If b_0=0 and is NOT significantly different than 0, this means that the stock is NOT offering excess returns or less returns over the market; in other words, when the market returns=0, it is expected that the stock also will have returns=0.
if b>0 and is significantly greater than 0, this means that the stock is significantly offering returns over the market; in other words, the stock is significantly beating the market. it is supposed that according to the efficient hypothesis in financial markets, there is NO stock, instrument or portfolio that systematically beats the market. Then, most of the time when we run a market regression model, b_0 will NOT be significantly different than zero.
if b_0<0 and is significantly less than 0, this means that the stock is significantly offering returns bellow the market; in other words, the stock is significantly underperforming with respect to the market.
In the following sections, I collecte real data to run a Market Regression model.
11.4 Getting data and visualizing possible relationship
Now it’s time to use real data to better understand Regression models.
We download monthly prices for CEMEX (CEMEXCPO.MX) and the Mexican market index IPCyC (^MXX) from Yahoo Finance from Dec 2020 to Dec 2025. With these prices we calculate continuously compounded (cc) returns of Cemex and the Market (MXX) and drop NA values:
import yfinance as yfimport pandas as pdimport numpy as npimport matplotlibimport matplotlib.pyplot as plt# Getting price data and selecting adjusted price columns:sprices=yf.download(tickers="CEMEXCPO.MX ^MXX", start="2020-12-01", end="2025-12-31",interval="1mo", auto_adjust=True)
[                       0%                       ]
[*********************100%***********************]  2 of 2 completed
# Selecting the close stock pricesprices = sprices['Close'].dropna()# Calculating cc returns:returns = np.log(sprices) - np.log(sprices.shift(1))# Deleting the first month with NAs:returns=returns.dropna()# I rename the columns; the first column is Cemex returns:returns.columns=['Cemexret','MXXret']# I view the first and last returns:print(returns.head())
We do a scatter plot including the regression line:
import seaborn as sbplt.clf()x = returns['MXXret']y = returns['Cemexret']# I plot the (x,y) values along with the regression line that best fits the data:sb.regplot(x=x,y=y)plt.xlabel('Market returns')plt.ylabel('Cemex returns')plt.show()
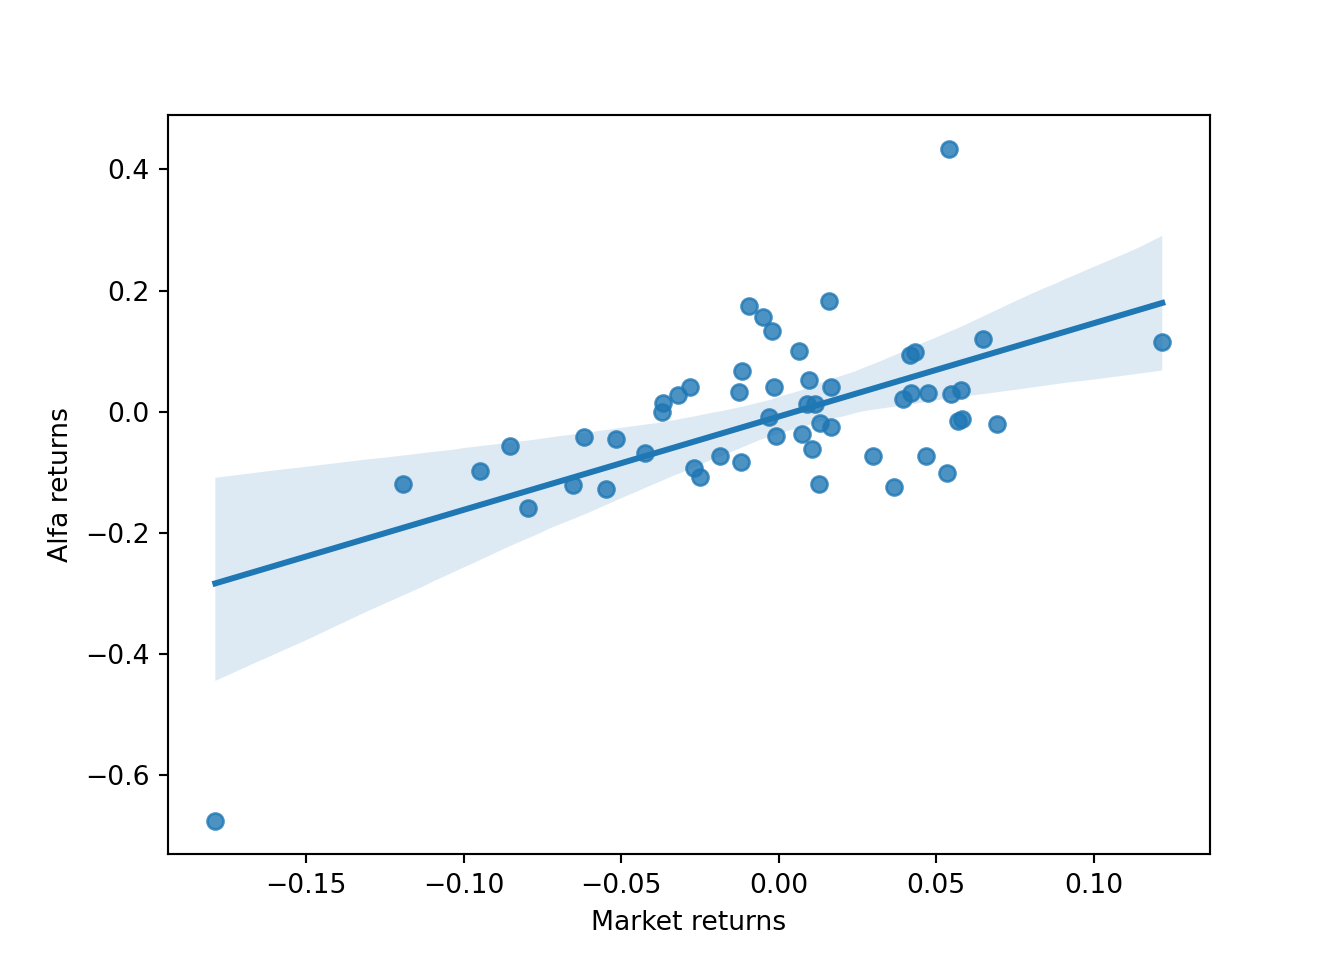
Scatter plots can be misleading when ranges of X and Y are very different. In this case, Cemex had a wider range of return values compared to the Market returns. Cemex has offered very negative returns from -60% to about +40%, while the Market returns had offered returns from about -17% to about +12%.
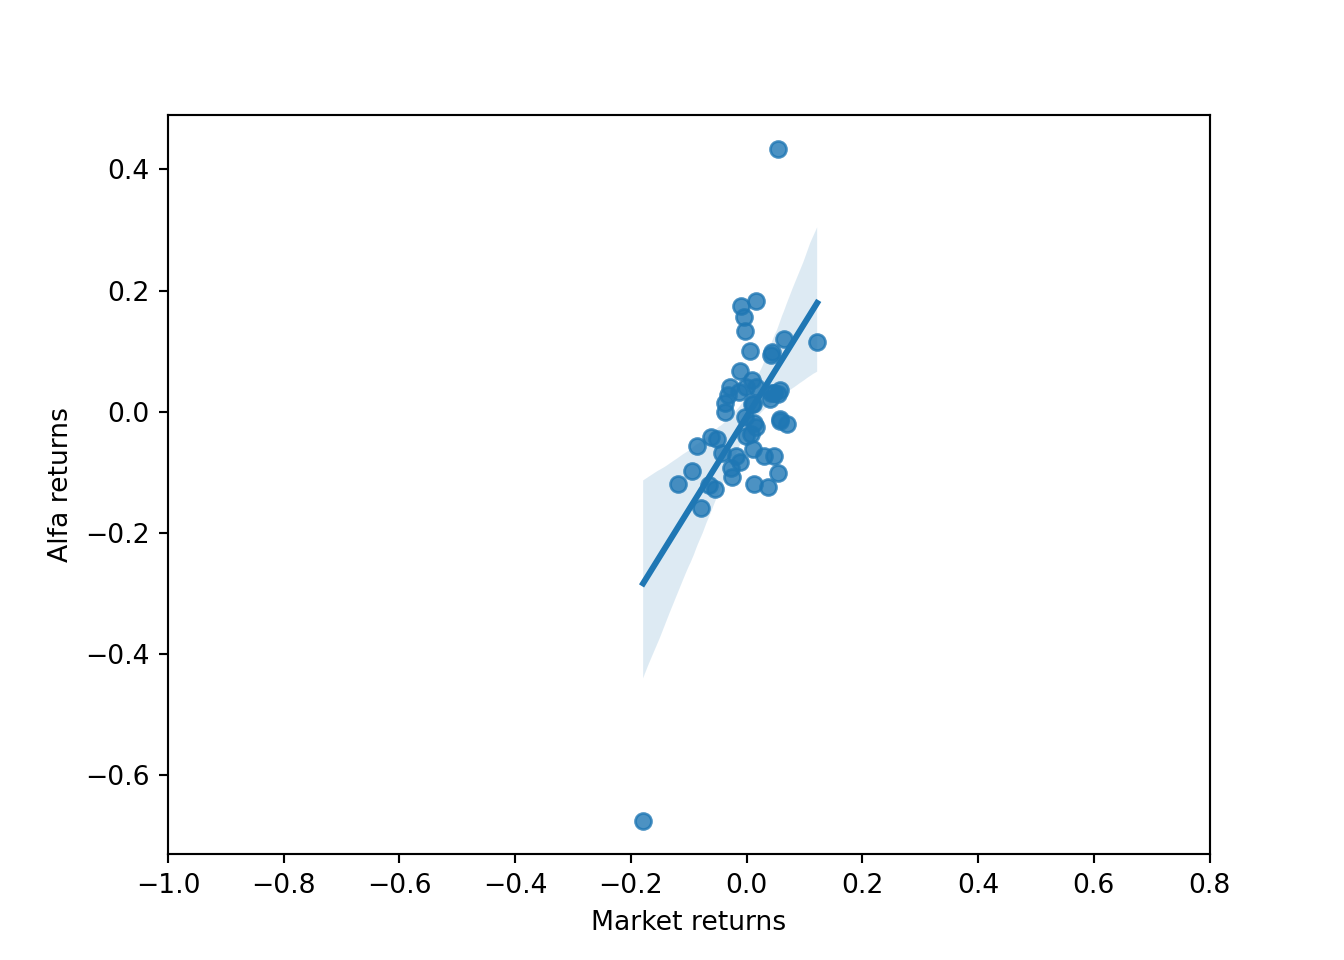
Then, we can re-do the scatter plot trying to make the X and Y axis using a similar scale fro both variables:
plt.clf()sb.regplot(x=x,y=y)# I adjust the scale of the X axis so that the magnitude of each unit of x is equal to that of the Y axis:plt.xticks(np.arange(-0.4,0.4,0.1))
([<matplotlib.axis.XTick object at 0x000001E45DBEE5D0>, <matplotlib.axis.XTick object at 0x000001E45DB8A990>, <matplotlib.axis.XTick object at 0x000001E45DBEFD90>, <matplotlib.axis.XTick object at 0x000001E45FC74190>, <matplotlib.axis.XTick object at 0x000001E45FC74550>, <matplotlib.axis.XTick object at 0x000001E45FC74910>, <matplotlib.axis.XTick object at 0x000001E45FC74CD0>, <matplotlib.axis.XTick object at 0x000001E45FC75090>], [Text(-0.4, 0, '−0.4'), Text(-0.30000000000000004, 0, '−0.3'), Text(-0.20000000000000007, 0, '−0.2'), Text(-0.10000000000000009, 0, '−0.1'), Text(-1.1102230246251565e-16, 0, '0.0'), Text(0.09999999999999987, 0, '0.1'), Text(0.19999999999999984, 0, '0.2'), Text(0.2999999999999998, 0, '0.3')])
# I label the axis:plt.xlabel("Market returns")plt.ylabel("Cemex returns")plt.show()
With this plot we have a better appreciation of the relationship between Cemex returns and Market returns. It looks a clear positive relationship, and a sensitivity close to 1 or a little bit higher since the slope of the line looks a little bit higher than 45 degrees. Let’s calculate the regression coefficients to see the estimation of this slope, which is the b_1 coefficient of the regression.
11.5 Estimating the market regression model
The OLS function from the statsmodel package is used to estimate a regression model. We run a simple regression model to see how the monthly returns of the stock are related with the market return.
The first parameter of the OLS function is the depenent variable (in this case, the stock return), and the second parameter must be the independent variable X, also named the explanatory variable (in this case, the market return).
What we will get is called the Market Regression Model, which examines how the market returns can explain the returns of a stock:
import statsmodels.api as sm# I add a column of 1's to the X dataframe in order to include the beta0 coefficient (intercept) in the model:X = sm.add_constant(x)# I estimate the OLS regression model:mkmodel = sm.OLS(y,X).fit()# I display the summary of the regression: print(mkmodel.summary())
The smf.ols function does the same, and it is easier to use:
# I can also run the OLS regression using the ols function import statsmodels.formula.api as smfmkmodel = smf.ols('Cemexret ~ MXXret',data=returns).fit()# This function does not require to add the column of 1's to include the intercept!print(mkmodel.summary())
I can save the coefficients and their standard errors, pvalues and 95% confidence intervals:
# beta coefficients:b0=mkmodel.params.iloc[0]b1=mkmodel.params.iloc[1]# standard errors:seb0 = mkmodel.bse.iloc[0]seb1 = mkmodel.bse.iloc[1]# t-Statistics:tb0 = b0 / seb0tb1 = b1 / seb1 # pvalues:pvalueb0 = mkmodel.pvalues.iloc[0]pvalueb1 = mkmodel.pvalues.iloc[1]# confidence level of each coefficient:confb0 =100* (1-pvalueb0)confb1 =100* (1-pvalueb1)# min and max of the 95% confidence level for each coefficient:minb0 = mkmodel.conf_int().iloc[0].iloc[0]maxb0 = mkmodel.conf_int().iloc[0].iloc[1]minb1 = mkmodel.conf_int().iloc[1].iloc[0]maxb1 = mkmodel.conf_int().iloc[1].iloc[1]
I can estimate the beta coefficients using matrix algebra instead of using a Python function:
# Using matrix algebra to estimate the beta coefficients:# I add the column of 1's to the dataframe:sr = returnssr['constant'] =1selcols = ['constant','MXXret']# I set x as a matrix with the column of 1's and the values of X:x = sr[selcols].values# I set y as the dependent variable:y = sr['Cemexret'].values# I calculate the matrix multiplication X'X:xtx = np.matmul(x.transpose(),x)# I calculate the matrix multiplication X'Y:xty = np.matmul(x.transpose(),y)# I get the inverse of the matrix (X'X) to solve for the beta coefficients:invtxt = np.linalg.inv(xtx)# I multiply inv(X'X)*X'Y to get the estimation of the beta vector (beta0 and beta1 coefficients) betas = np.matmul(invtxt,xty)betas
array([0.00328812, 1.35547273])
According to the estimation of beta coefficients, the regression equation is:
E[Cemexret] = 0.0033 + 1.3555 * MXXret
In the regression outputs we see not only the estimated beta coefficients, but also their standard error, t-Statistic, p-values, and their 95% confidence intervals.
Note that the regression function in Python automatically performs hypothesis testing for both coefficients, b_0 and b_1, where the null hypotheses are that the coefficients are equal to zero
In the next section we review about these estimations.
11.5.1 The standard error of the beta coefficients
The OLS method includes the estimation of the beta coefficients and also estimation of their corresponding standard errors. Then, what is the standard error of the beta coefficients?
The standard error of b_0 is actually an estimation of the expected standard deviation ofb_0. The same happens for b_1. But how we can estimate a standard deviation of a beta coefficient? It seems that we need several possible values of b_0 and b_1, so I could estimate their standard deviation as a measure of standard error. Then, we would need many samples to estimate several possible pair values of beta coefficients. However, most of the time we only use 1 sample to estimate the beta coefficients and their standard errors. Then, why do we need to estimate the expected standard deviation of the coefficients?
In several disciplines, when we want to understand the relationship between 2 random variables, we only have access to 1 sample (not the population), so we need to find a way to estimate the error levels we might have with the beta estimations. Then, we need to find a way to estimate the possible variation of the beta coefficients as if we would had the possibility to collect many samples to get many possible pairs of beta coefficients.
It sound weird, but it is possible to estimate how much the b_0 and b_1 might vary using only 1 sample. We can use basic probability theory and the result of the Central Limit Theorem to estimate the expected standard deviation of the beta coefficients, their corresponding t-values, p-values and their 95% confidence intervals.
To estimate the standard errors of the coefficients, we need to estimate the standard deviation of the Y variable, which is actually the standard deviation of the errors, and it is also called mean squared errors (MSE).
The formula to estimate the standard deviation of the regression errors, mean squared errors (MSE), is:
MSE=\frac{SSE}{N-2}
Where: SSE = Sum of squared errors:
The SSE is divided by N-2 since we need 2 parameters (b_0 and b_1) to estimate SSE.
The SSE is calculated as:
SSE = \sum_{i=1}^{N}(y_i-\hat{y})^2
The formula to estimate the standard error (SE) of b_1 is the following:
These estimations are automatically calculated and displayed in the output of any regression software. By learning their formulas we see that the magnitude of standard error of both coefficients is directly proportional to the standard deviation of the the errors, which is the mean of squared regression errors (MSE). Then, the greater the individual magnitude of errors, the greater the standard error of both beta coefficients, so the more difficult to find significant betas (betas that are significantly different than zero).
11.6 Interpretation of the regression output
The important output is in the coefficients table. The (intercept) row is the information of the beta0 coefficient (b_0), while the MXXret row is the information about the beta1 coefficient (b_1). The estimate column has the mean value for b_0 and b_1; we can also see the standard errors, t-value and p-value of the b_0 and b_1.
In the context of the market regression model, the b_0 has an important meaning. If we find that b_0 is significantly greater than zero, then we can say that the stock is systematically offering positive returns over the market. In Finance the b_0 coefficient is called Alpha of Jensen, and it is supposed to always be zero or NOT significantly different than zero according to the market efficiency hypothesis.
For b_0, the hypothesis test is the following:
H0: b_0 = 0
Ha: b_0\neq0
In this hypothesis, the variable of analysis is beta0 (b_0).
Following the hypothesis test method, we calculate the corresponding t-value of this hypothesis as follows:
t=\frac{(b_{0}-0)}{SD(b_{0})}
Then, t = (0.0033 - 0) / 0.0103) = 0.3181. This value is automatically calculated in the regression output in the coefficients table in the row (intercept).
Remember that t-Statistic is the distance between the estimated beta value and its hypothetical value, which is zero. But this distance is measured in standard deviations of the beta. Remember that the standard error of the variable of analysis is called standard error (in this case, the std.error of b_0 = 0.0103.
Since the absolute value of the t-value of b_0 is less than 2, then we cannot reject the null hypothesis. In other words, we can say that b_0 is not significantly less than zero (at the 95% confidence level).
For b_1 the hypothesis test is:
H0: b_1=0 (there is no relationship between the market and the stock return)
Ha: b_1>0 (there is a positive relationship between the the market and the stock return)
In this hypothesis, the variable of analysis is b_1.
Following the hypothesis test method, we calculate the corresponding t-Statistic of this hypothesis as follows:
t=\frac{(b_{1}-0)}{SD(b_{1})}
Then, t = (1.3555 - 0) / 0.2305 = 5.8798. This value is automatically calculated in the regression output in the coefficients table in the second row of the coefficient table.
Remember that t-Statistic is the distance between the estimated value of the beta and its hypothetical value, which is zero. But this distance is measured in standard deviations of the beta. Remember that the standard error of the variable of analysis is called standard error (in this case, the std.error of b_1 = 0.2305).
Since the absolute value of the t-value of b_1 is much greater than 2, then we have enough statistical evidence at the 95% confidence to say that we reject the null hypothesis. In other words, we can say that b_1 is significantly greater than zero. We can also say that there is a positive and significant relationship between the stock return and the market return.
11.7 More about the interpretation of the beta coefficients and their t-values and p-values
Then, in this output we see that b_0 = 0.0033, and b_1 = 1.3555. We can also see the standard error, t-value and p-value of both b_0 and b_1.
b_0 on average is negative, but it is not significantly negative (at the 95% confidence) since its p-value>0.05 and its absolute value of t-value<2. Then I can say that it seems that Cemex return on average under-performs the market return by 0.3288% (since b_0 = 0.0033). In other words, the expected return of Cemex when the market return is zero is negative. However, this is not significantly less than zero since its p-value>0.05! Then, I do not have statistical evidence at the 95% confidence level to say that Cemex under-performs the market.
b_1 is 1.3555 (on average). Since its p-value<0.05 I can say that b_1 is significantly greater than zero (at the 95% confidence interval). In other words, I have strong statistical evidence to say that Cemex return is positively related to the market return since its b_1 is significantly greater than zero.
Interpreting the magnitude of b_1, we can say that if the market return increases by +1%, I should expect that, on average,the return of Cemex will increase by 1.3555%. The same happens if the market return losses 1%, then it is expected that Cemex return, on average, losses about 1.3555%. Then, on average it seems that Cemex is riskier than the market. But we need to check whether it is significantly riskier than the market.
In this context, an important analysis of b_1 is to check whether b_1 is significantly more risky or less risky than the market. In other words, it is important to check whether b_1 is less than 1 or greater than 1. To do this we can do another hypothesis test to check whether b_1 is significantly greater than 1.
We can do the following hypothesis test to check whether Cemex is riskier than the market:
H0: b_1 = 1 (Cemex is equally risky than the market)
Ha: b_1 > 1 (Cemex is riskier than the market)
In this hypothesis, the variable of analysis is beta1 (b_1).
Following the hypothesis test method, we calculate the corresponding t-value of this hypothesis as follows:
t=\frac{(b_{1}-1)}{SD(b_{1})}
Then, t = (1.3555 - 1) / 0.2305 = 1.542. This value is not automatically calculated in the regression output.
Since t-Statistic is very close to 2, so it is hard to judge whether b_1 is significantly greater than 1 at the 95% confidence interval. We need to calculate its corresponding p-value. If the p-value is 0.06, then we can say that we have evidence at the 94% confidence to reject the null hypothesis. In other words, we can say that Cemex is significantly riskier than the market (at the 94% confidence level).
It is important that you use your criteria for the p-value of the test according to the context of the problem. There is noan easy rule to reject the null if the t-value is >2!
11.8 95% confidence interval of the beta coefficients
We can use the 95% confidence interval of beta coefficients as an alternative to make conclusions about b_0 and b_1 (instead of using t-values and p-values).
In this case we see that the minimum value of the 95% c.i. Of b_1 is 0.894, and its maximum is 1.8169. These values are calculated by subtracting and adding about 2 times its standard error from the mean beta.
The first row shows the 95% confidence interval for b_0, and the second row shows the confidence interval of b_1.
How we interpret the 95% confidence interval forb_0?
In the near future, b_0 can have a value between -0.0174 and 0.024 95% of the time. In other words b_0 can move from a negative value to zero to a positive value. Then, we cannot say that 95% of the time, b_0 will be negative. In other words, we conclude that b_0 is not significantly negative at the 95% confidence level.
How often b_0 will be negative? Looking at the 95% confidence interval, b_0 will be negative more than 50% of the time. Being more specific, we calculate this by subtracting the p-value from 1: (1-pvalue). In this case, the p-value= 0.7515. Then (1-0.7515) = 24.8466 % of the time b_0 will be positive.
How we interpret the 95% confidence interval forb_1?
In the near future, b_1 can move between 0.894 and 1.8169 95% of the time. In other words, b_1 can have a value greater than 1 around 93% of the time. Then, we can say that b_1 is significantly positive and greater than 1 at the 93%. In other words, Cemex is significantly riskier than the market since its b_1>1 at least 93% of the time.
To further understand the standard error of beta coefficients we will do an exercise to estimate several regression models using different time ranges. Each regression will estimate one value for b_0 and one value for b_1. Then, if we run N regressions, we will have N pairs of beta coefficients, so we will see how these beta coefficients change over time. This change is measured by the standard error of the beta coefficients.
11.9 Estimating moving betas for the market regression model
How the beta coefficients of a stock move over time? Are the b_1 and b_0 of a stock stable? if not, do they change gradually or can they radically change over time? We will run several rolling regression for Cemex to try to respond these questions.
Before we do the exercise, I will review the meaning of the beta coefficients in the context of the market model.
In the market regression model, b_1 is a measure of the sensitivity; it measures how much the stock return might move (on average) when the market return moves in +1%.
Then, according to the market regression model, the stock return will change if the market return changes, and also it will change by many other external factors. The aggregation of these external factors is what the error term represents.
It is said that b_1 in the market model measures the systematic risk of the stock, which depends on changes in the market return. The unsystematic risk of the stock is given by the error term, that is also named the random shock, which is the summary of the overall reaction of all investors to news that might affect the stock (news about the company, its industry, regulations, national news, global news).
We can make predictions of the stock return by measuring the systematic risk with the market regression model, but we cannot predict the unsystematic risk. The most we can measure with the market model is the variability of this unsystematic risk (the variance of the error).
In this exercise you have to estimate rolling regressions by moving time windows and run 1 regression for each time window.
For the same CEMEXCPO.MX stock, run rolling regressions using a time window of 36 months, starting from Jan 2010.
The first regression has to start in Jan 2010 and end in Dec 2012 (36 months). For the second you have to move time window 1 month ahead, so it will start in Feb 2010 and ends in Jan 2013. For the third regression you move another month ahead and run the regression. You continue running all possible regressions until you end up with a window with the last 36 months of the dataset.
This sounds complicated, but fortunately we can use the function RollingOLS that automatically performs rolling regressions by shifting the 36-moth window by 1 month in each iteration.
Then, you have to do the following:
Download monthly stock prices for CEMEXCPO.MX and the market (^MXX) from Jan 2010 to Jul 2022, and calculate cc returns.
# Getting price data and selecting adjusted price columns:sprices = yf.download("CEMEXCPO.MX ^MXX",start="2010-01-01",interval="1mo", end="2025-12-31",auto_adjust=True)
[                       0%                       ]
[*********************100%***********************]  2 of 2 completed
sprices = sprices['Close']# Calculating returns:sr = np.log(sprices) - np.log(sprices.shift(1))# Deleting the first month with NAs:sr=sr.dropna()sr.columns=['Cemexret','MXXret']
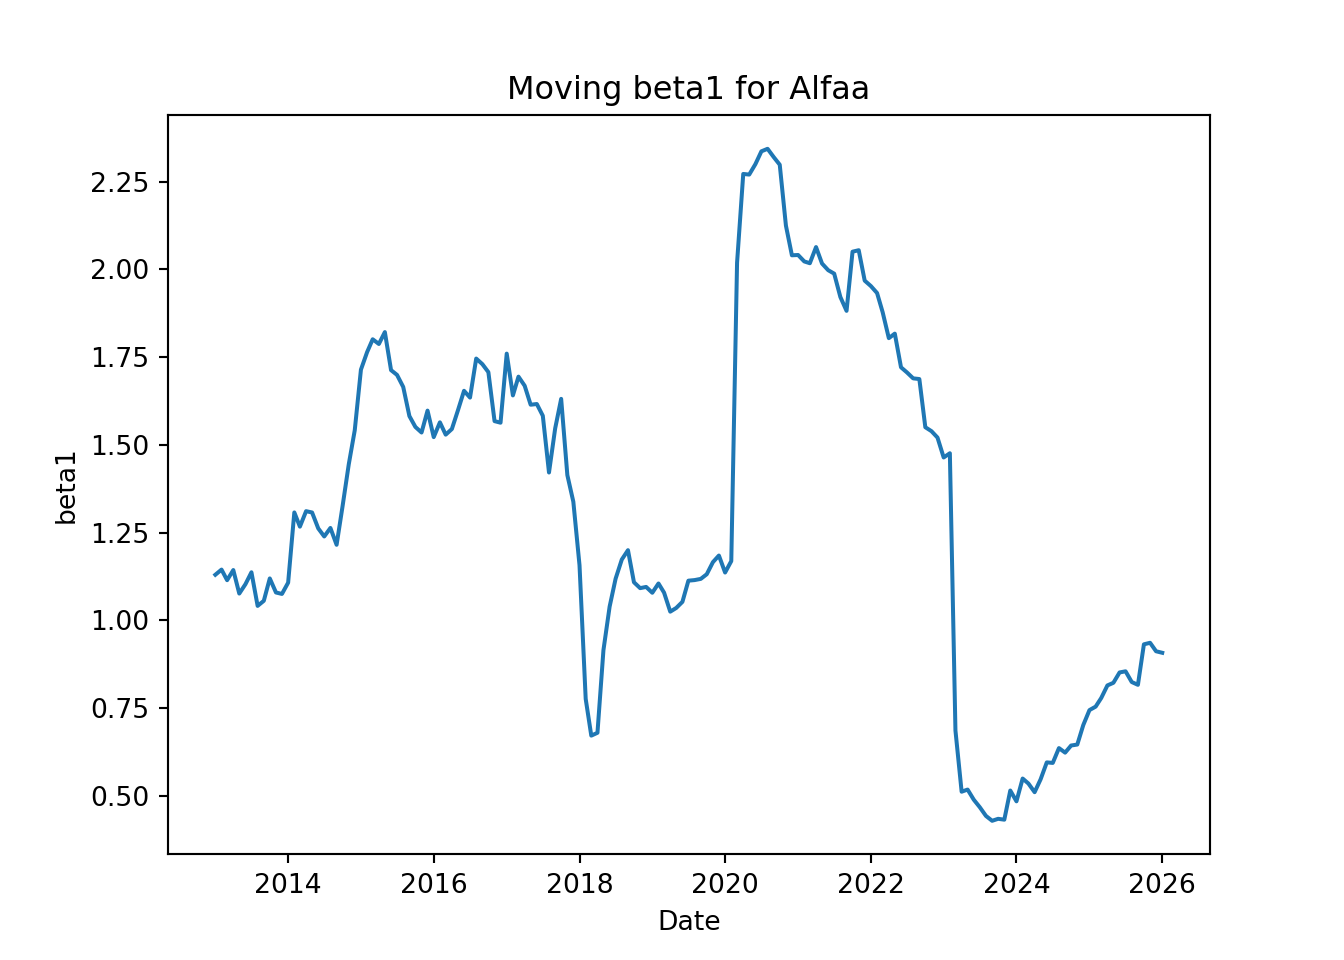
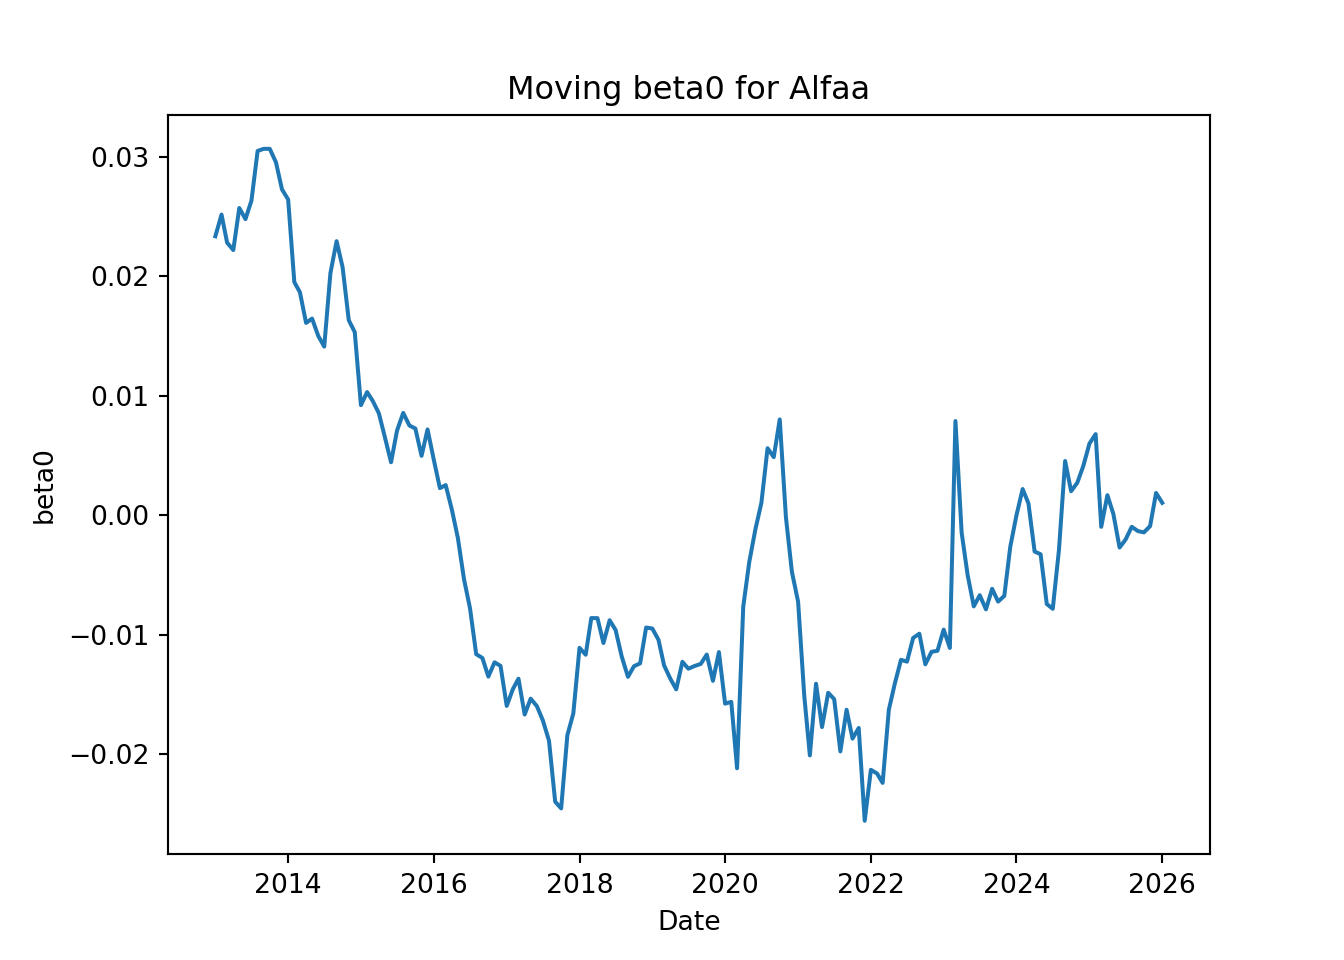
Run rolling regressions and save the moving b_0 and b_1 coefficients for all time windows.
from statsmodels.regression.rolling import RollingOLSx=sm.add_constant(sr['MXXret'])y = sr['Cemexret']rolreg = RollingOLS(y,x,window=36).fit()betas = rolreg.params# I check the last pairs of beta values:betas.tail()
Do a plot to see how b_1 and b_0 has changed over time.
plt.clf()plt.plot(betas['MXXret'])plt.title('Moving beta1 for Cemex')plt.xlabel('Date')plt.ylabel('beta1')plt.show()
plt.clf()plt.plot(betas['const'])plt.title('Moving beta0 for Cemex')plt.xlabel('Date')plt.ylabel('beta0')plt.show()
We can see that the both beta coefficients move over time; they are not constant. There is no apparent pattern for the changes of the beta coefficients, but we can appreciate how much they can move over time; in other words, we can visualize their standard deviation, which is the average movement from their means.
We can actually calculate the mean and standard deviation of all these pairs of moving beta coefficients and see how they compare with their beta coefficients and their standard errors of the original regression when we use only 1 sample with the last 36 months:
betas.describe()
            const      MXXret
count  156.000000  156.000000
mean    -0.000804    1.494473
std      0.009638    0.471783
min     -0.021414    0.466349
25%     -0.005617    1.271972
50%     -0.001529    1.467526
75%      0.004914    1.647231
max      0.032497    2.802835
We calculated 116 regressions using 116 36-month rolling windows. For each regression we calculated a pair of b_0 and b_1.
Compared with the first market regression of Cemex using the most recent months from 2018 (about 54 months or 4.5 years), we see that the mean of the moving betas is very similar to the estimated beta of the first regression. Also, we see that the standard deviation of the moving b_0 is very similar to the standard error of b_0 estimated in the first regression. The standard deviation of b_1 was much higher than the standard error of b_1 of the first regression. This difference might be because the moving betas were estimated using data from 2010, while the first regression used data from 2018, so it seems that the systematic risk of Cemex (measured by its b_1) has been reducing in the recent months.
I hope that now you can understand why we need an estimation of the standard error of the beta coefficients (standard deviation of the coefficients).
Next we will learn how to use the estimated beta coefficient and their corresponding standard errors to calculate their corresponding t-Statistic, p-value and their 95% confidence interval.
11.10 t-Statistic, p-value and 95% confidence interval of beta coefficients
11.10.1 Hypothesis tests for the beta coefficients
When we run a linear regression model, besides the estimation of the beta coefficients and their corresponding standard errors, one hypothesis test is performed for each beta coefficient.
We apply the hypothesis test to each of the beta coefficients to test whether the beta coefficient is or is not equal to zero.
For the case of the simple market regression, the following hypothesis are performed:
For b_0:
H0: The mean of b_0 = 0 Ha: The mean of b_0>0 (Our hypothesis)
In this case, the variable of study for the hypothesis test is theb_0 coefficient.
Then, we calculate the t-Statistic for b_0 as follows:
t =\frac{(b_0 - 0)}{SE(b_0)}
For b_1 the same process is performed:
H0: The mean of b_1=0 Ha: The mean of b_1>0 (Our hypothesis)
In this case, the variable of study for the hypothesis test is theb_0 coefficient.
Then, we calculate the t-Statistic as follows:
t =\frac{(b_1 - 0)}{SE(b_1)}
SE(b_1) is the standard error of b_1, which is its estimated standard deviation.
Then, we follow the same logic as it is explained above to make a conclusion about b_1.
In the context of market regression model, b_1 not only measures the linear relationship between the stock return and the market return; b_1 is a measure of systematic market risk of the stock. If the p-value(b_1<0.05 and b_1>0, then we can say that the stock return is positively and significantly related to market return.
Another interesting hypothesis test for b_1 is the examine whether b_1 is significantly greater or less than 1 (not zero). If b_1 is significantly greater than 1, then we can say that the stock is significantly riskier than the market. Unfortunately, this hypothesis is NOT tested in the traditional output of the regression model. We need to calculate the corresponding t-Statistic for this test manually.
11.10.2 The 95% confidence interval for each coefficient
Besides the standard error, t-Statistic and p-value, the 95% confidence interval (C.I.) is also calculated for each beta coefficient. The 95% C.I. has a minimum and maximum possible value. The 95% C.I. illustrates how much the beta coefficient can move 95% of the time.
An approximate way to estimate the minimum and maximum of this 95% C.I. is just by subtracting and adding 2 standard errors to the beta coefficient. For example, an approximate 95% C.I. for b_0 can be estimated as:
The exact critical value for the 95% is not 2, it depends on the number of observations, but it can go from 1.8 to 2.1. The exact values of the 95%C.I. are automatically calculated when we run the regression model.
The 95% C.I. of a beta coefficient tells us the possible movement of the beta according to its standard error.
We can use the 95% C.I. instead of the t-Statistic or p-value to make the same conclusion for the hypothesis test of the coefficient. If the 95%C.I. does NOT contain the zero, then it means that the beta coefficient is significantly different than zero. An advantage of the 95%C.I. is that we could quickly test the hypothesis that b_1>1 to check whether a stock is significantly riskier; if the 1 is not included in the 95% C.I. and b_1>1, then we can say that the stock is significantly riskier than the market at the 95% confidence level.